Monitoring servers with ElasticSearch
When you want to be flexible with server monitoring data ElasticSearch is a good option to collect data. With the ElasticSearch queries you can be creative on which data you want to see. Also the Kibana kan help visualising data and making dashboards. In this blog post I will show you how this can be done.
Docker First
To build an example we will work with Docker. Of course you can set up ElasticSearch and Kibana directly on the OS. Here an example of installing docker on Ubuntu:
#Install docker
sudo apt install docker.io
After docker is installed you can find the version with
docker version
Run ElasticSearch and Kibana
When Docker is ready to run on your Linux (in our case Ubuntu)/MAC OS/Windows you can start pulling ElasticSearch and Kibana from the repository. With this commands you will pull the latest version:
sudo docker pull elasticsearch
sudo docker pull kibana
Now we have the images in our docker we will run them with the parameters that I will explain after. Note; you can also execute commands bellow and the will pull in the Docker images if this not exists.
# Run ElasticSearch
sudo docker run -d -p 9200:9200 -p 9300:9300 --name Elastic elasticsearch

#Run Kibana and link to previous Elastic Docker
sudo docker run -d -p 5601:5601 --link Elastic:elasticsearch --name Kibana kibana
The first docker run will launch a docker container with the Elasticsearch image and give it the name “Elastic”. With the “-d” command it will launch as a daemon and the “-p” command will advertise the port numbers to the host machine so we can access it.
In the second part the “–link” will create the hostname “elasticsearch” in the hosts file and link this to the Elastic container IP.
Monitor with Metricbeat
For this example we will use Metricbeat from Elastic.io to monitor a Windows machine and send the data to our elastic container. You can download the latestMetricbeat here : https://www.elastic.co/downloads/beats/metricbeat
Download the latest Window 64-bit version and unzip the content from this folder in “C:\Program Files\Metricbeat”. It should look like this:
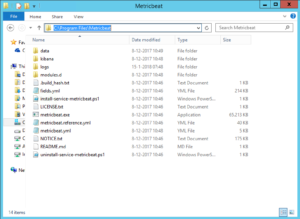
Once this is copied as in the image showed above we will configure the Elastic container as destination for the Metricbeat date. Open “metricbeat.yml” with notepad and change the following line(s):
output.elasticsearch:
# Array of hosts to connect to.
hosts: ["192.168.1.10:9200"]

# Optional protocol and basic auth credentials.
#protocol: "https"
#username: "elastic"
#password: "xpacksecretpassword"
The first part we point the metricbeat installation to our Docker host with IP address “192.168.1.10”, since we advertised port 9200 to our Docker host this port should be accessible. Fill in your own Docker host IP and check if you get response in your browser on http://dockerhostip:9200.
In the second part we have the settings that are needed when you secured your Elastic cluster with X-Pack extension. No need to configure this now for this example.
Now we have configured Metricbeat we want to install this as an Windows Service and run it. Open PowerShell as Administrator and run the command:
cd "C:\Program Files\Metricbeat"
install-service-metricbeat.ps1
Start-Service metricbeat
With the executable we can also install the Kibana example dashboards for Metricbeat, this is only needed 1 time:
metricbeat setup --dashboards
Kibana Dashboard
With the dashboard installation from Metricbeat in the last step we have some examples to watch. Check first if your data is in Elastic with the following URL:
http://dockerhostip:9200/_cat/indices?v
This page should return the indices created on our Elastic container and also you will see the .metricbeat indice with an date. By default metric beat will create an new indice every day. With ElasticSearch you can easily query more indices at the same time. Now we go to Kibana:
http://dockerhostip:5601
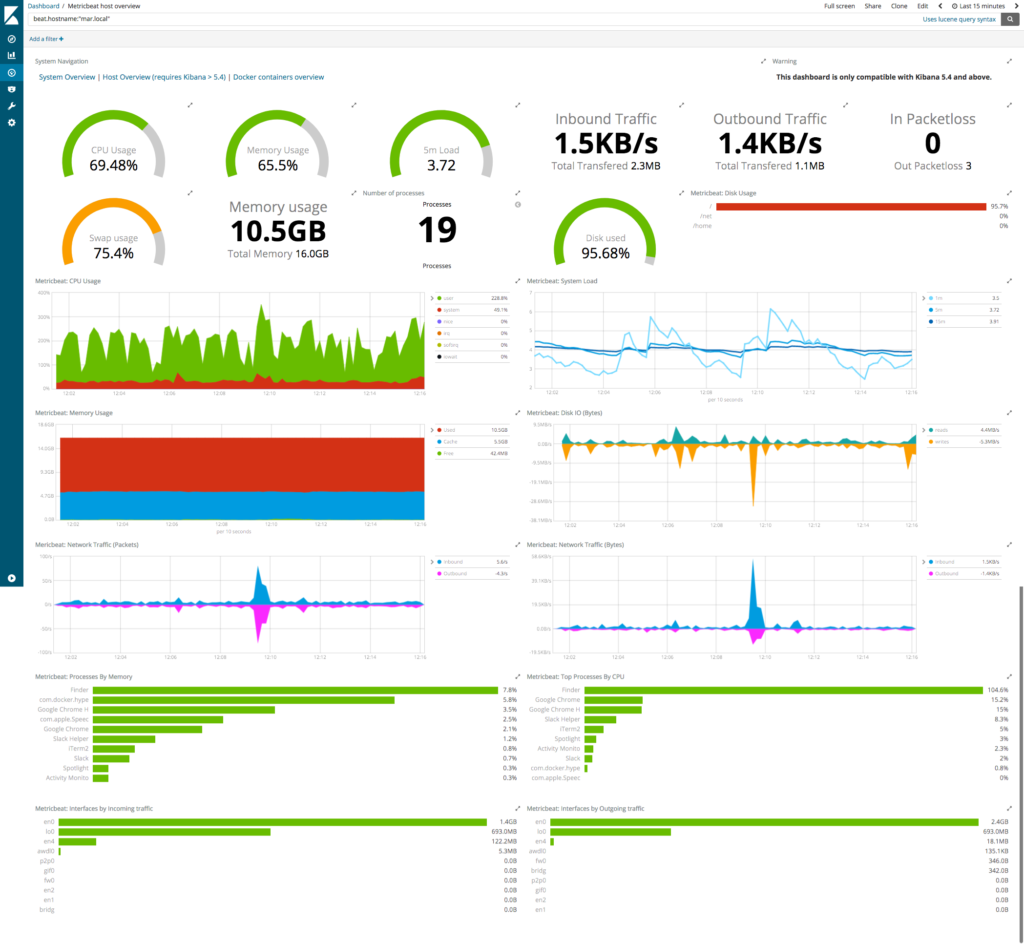
If we go to Dashboard and find the “Metricbeat host overview” you can find an example dashboard that showed the connected hosts and some average CPU, Memory and Network numbers based on the data available, filter and timefilter that you can see in the top right corner.
2 thoughts on “Monitoring servers with ElasticSearch”
Thanks a bunch for sharing this with all of us you really recognize what you are speaking approximately! Bookmarked. Please also discuss with my site =). We will have a link alternate contract between us!
go to the website
Howdy would you mind stating which blog platform you’re
using? I’m looking to start my own blog soon but I’m having a hard time making a decision between BlogEngine/Wordpress/B2evolution and Drupal.
The reason I ask is because your design and style seems different then most blogs and
I’m looking for something unique. P.S Sorry for being off-topic but I had to ask!
http://tinyurl.com/yazdr3zu
Comments are closed.